


SAP BusinessObjects is a Business Intelligence platform, a world leading software suite that enables organisations to access and control, manipulate and secure, visualise and distribute their data. The suite includes many tools, but chief among them for easy analytical visualisation is Web Intelligence.
Web Intelligence has been part of the BusinessObjects suite since the early 2000s, having been conceived as a successor to Desktop Intelligence. As its name implies it was envisaged as a web-based reporting tool complementing the, you guessed it, desktop-based Desktop Intelligence. ‘DeskI’ has been phased out now and fully replaced by ‘WebI’ – so much so that there is now a desktop-based version of Web Intelligence!
Web Intelligence allows report builders to connect to multiple different data sources: SAP universes, SAP BW and SAP HANA, spreadsheets, CSV files as well as direct to relational databases. This flexibility grants users power over their data, and the ability to create mash-ups of information with little input from IT.
The tool is easy to master, DSCallards provide workshops spanning 1, 2 or 3 days depending on the needs of the learners. It is a drag and drop environment, with no need to code on the data side, and a simple but powerful formula language (similar to Excel) on the report-design side.
The output of a WebI report can be simple and throw-away, answering ad-hoc questions in seconds, or it can be sophisticated and permanent – complex recurring scheduled reports, well paginated, with logos and meta-data, sent direct to recipients’ email or file-shares. WebI can also do dashboards: interactive or automated, with onscreen filtering, hyperlinks between documents and drill-down through hierarchies.
Power over data is not limited to your skilled report-builders either, even report viewers can navigate through report structures, use input controls to change views, choose parameters and filter data. The output can be viewed in the SAP BI Launchpad web-app or as PDFs or spreadsheets. CSV or TXT files can also be created and exported if the data needs to be re-used elsewhere. Connectivity to MS Office documents or SharePoint is also a feature.
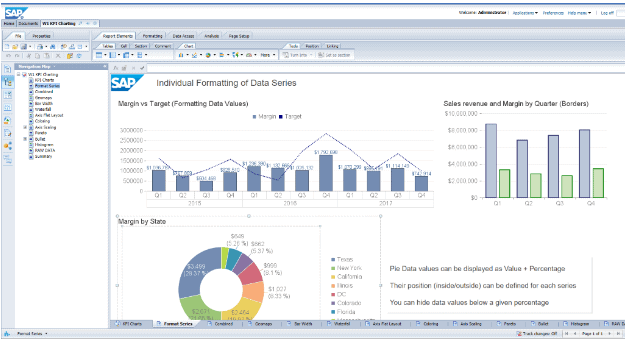
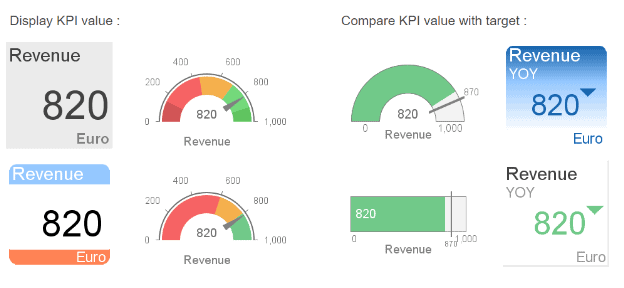
There are many modern visualisation-types available out-of-the-box and more available through 3rd-party plug-ins. Mapping, KPI tiles, word-clouds, box-plot charts, heat maps and gauges are all catered for alongside traditional pie charts, bar charts and line graphs. All can be customised and edited with bespoke colour schemes and fine control over appearance and format.
WebI can handle millions of rows of data just as well as smaller data-sets. It is scalable for hundreds of users at an organisation, and works with databases distributed globally. It can also work for single users against a single local database, providing reporting for small businesses – SAP provide licencing models for either scenario or anywhere in-between.
The thin-client version of the tool uses HTML or Java and works in all modern browsers (Chrome, Firefox, Edge, IE etc). ‘Web Intelligence Rich Client’ is the thick-client locally installed version – this is favoured by high-intensity users as it grants a stable platform for larger reports and does not timeout if you leave it alone for sustained periods.
Web Intelligence is ideal for business users who do not want to rely on IT or other specialists for their report design. Call DSCallards today to see about a demonstration of what Web Intelligence can provide for your organisation.


